



Learn which help desk metrics reveal workload and service risks, and how B2B teams use them to improve customer operations and team coordination.
Customers find answers. Tickets get resolved. Your help desk becomes a single source of truth, supporting customers at every step. On the surface, everything looks like it’s running exactly as it should.
So, why aren’t revenue and rep productivity improving? Because somewhere along the way, your help desk metrics stopped reflecting how customer work moves through the organization.
As operations scale, teams spend more time coordinating than problem-solving, and dashboards turn into numbers to optimize rather than read. The charts look clean — stable averages, high service-level agreement (SLA) compliance, and fast response times — but they hide tangled workflows underneath. Not every metric leads to a better decision.
This article explains which help desk metrics matter, how successful B2B teams use them, and how to separate meaningful signals from vanity metrics.
Why some help desk metrics matter and others create noise
Before tracking a help desk metric, ask yourself: What will this tell us?
Teams often adopt the same metrics everyone else uses simply because they’re standard. But metrics should help you understand and improve operations, not just fill a dashboard. Pick the ones that lead somewhere useful: better help desk performance and a stronger customer experience.
The right metrics answer:
Where is work getting stuck?
Which teams are overloaded?
Where are customer commitments at risk?
Which processes are creating delays?
How well are teams coordinating customer work?
Without clear answers, you get dashboards full of numbers but very little insight. Focus on metrics that expose visibility gaps and show where workload needs rebalancing. That’s what turns reporting into better decisions.
When good-looking metrics lead to bad decisions
More data doesn’t equal better decisions. Teams often try to track everything but, in the process, lose sight of what creates a high-quality service experience. These are the realities that matter.
Ticket volume doesn’t explain operational health
Ticket volume alone can’t tell you whether your help desk is performing well. High ticket volume can look like bad staff performance when the real issue is a broken product feature. That misdiagnosis leads teams to fix the wrong problems while the actual bug remains active. Customers grow frustrated and churn, and staff feel blamed for system flaws they can’t control.
Fast responses don’t mean fast resolutions
Quick responses are easy to achieve with AI-assisted replies and automations. But a fast response doesn’t guarantee fast resolution.
When coordination is slow or handoffs are messy, resolution drags even if the first reply goes out immediately. Fast replies create the appearance of progress, but real speed comes from efficient coordination, clear ownership, and smooth handoffs. Without that foundation, AI only speeds up the first message, not the final outcome.
Closed tickets don’t always mean customer issues are solved
Many support teams treat closing a ticket as the finish line. The workflow ends, the metric ticks up, and the dashboard looks clean.
But that linear view misses the bigger picture. A customer may run into the same problem multiple times, push back on a fix that doesn’t work in their environment, or need further clarification because the original answer created new questions.
When these moments fall outside the workflow, help desk analytics show closed tickets as fully resolved even though the underlying problem persists.
Metrics without context create blind spots
Metrics show you what happened, but without context, you won’t know why. That gap hides operational issues underneath.
A team may look fast because they close tickets quickly, but the metric doesn’t show that they’re bouncing issues between tools or re-answering the same questions. Churn may rise even as dashboard numbers look great because the metric tracks ticket volume, not customer friction. Reward speed over real problem solving, and you mistake extra work for productivity.
MongoDB’s disconnected email setup made the team appear proactive and responsive, but it really created chaos. Four different team members could reply to the same customer email at once, leading to duplicated work and wasted time. Without centralized tracking, the team also struggled to maintain context across conversations stored in separate tools. The metrics looked healthy, the underlying workflow was anything but.
6 help desk KPIs that reveal what’s really happening
1. First response time
First response time (FRT) measures how fast your team responds to a new request. A fast FRT signals that the request matters and that someone is taking ownership right away.
Calculate it by dividing total time to first response by the number of requests. When FRT slows, it usually points to capacity strain or inefficient processes. Either way, slow responses quickly erode customer satisfaction (CSAT) because the support you promise doesn’t match the support you deliver.
2. Resolution time
Resolution time, also known as time to resolution, refers to the total time it takes from a customer’s first contact to full resolution, including any waiting time between interactions.
To calculate resolution time, divide the total resolution time for all tickets by the total number of resolved tickets. The faster you reach resolution, the better the customer experience is, as long as issues are resolved thoroughly. It also means that customers don’t have to jump through hoops to get answers.
3. Customer satisfaction
CSAT surveys use direct customer feedback to capture how customers feel immediately after an interaction. Teams can use this direct feedback to turn customer sentiment into a measurable metric.
Calculate CSAT by dividing satisfied responses by total responses, then multiplying by 100. A high score means the interaction met or exceeded expectations; a low one signals friction — unclear answers, slow progress — that can compound and hurt retention over time.
4. SLA compliance
SLA compliance measures how often your team meets the performance targets outlined in an agreement.
To calculate SLA compliance, divide the number of service requests handled within the agreed time frame by the total number of requests, then multiply by 100. A higher compliance rate indicates your team is consistently meeting its service commitments.
5. Escalation rate
Escalation rate is the percentage of support requests escalated to a higher-level support tier due to complexity or incomplete resolutions.
Divide the number of escalated requests by the total number of requests submitted during a set period, then multiply by 100. Frequent escalations often point to confusing product designs or rushed resolutions to hit speed targets.
6. Workload and queue health
The amount of work your team has to handle influences how efficiently your customer support workflows operate. When teams frequently handle a high volume of complex tickets, missed goals and slowdowns become inevitable. That’s why it’s important to track work distribution and operational capacity.
While workload isn’t captured by a single metric, indicators like active queues, ticket volume, staff capacity, and average handle time can provide insights into workload and queue health.
Complexity changes the help desk metrics that matter
A metric on the dashboard doesn’t show the customer work behind it. As customer operations get more complex:
Ownership becomes harder to track: As teams grow, ownership gets distributed across more people and queues. That makes core metrics, like resolution time, harder to attribute and act on.
Customer context gets lost during handoffs: Every handoff introduces risk of information loss. As tickets move between teams, the narrative behind the customer’s issue often thins out. Metrics show what happened, but not the missing context or the friction the customer experienced along the way.
Reporting becomes fragmented across systems: As customer operations expand across tools, help desk data gets scattered. Your team ends up putting in more effort to reconcile metrics, and confidence in numbers drops because no single source shows the full picture.
Workload imbalances become harder to spot: Larger teams can mask uneven workloads. Without the right visibility, help desk metrics may look healthy even when some reps are overloaded and others have capacity.
Turning help desk metrics into results: Best practices
Use these best practices to turn help desk metrics into meaningful operational improvements:
Catch bottlenecks before service levels decline: Act early when work starts slowing down. Rebalance capacity and fix process gaps before service levels suffer.
Improve ownership and accountability: Clarify who owns the problem, set expectations, and follow through until the issue is resolved — not just assigned.
Surface recurring customer issues: Turn repeated signals into action. Find the root cause and assign an owner fast, before a pattern turns into churn.
Strengthen cross-functional coordination: Bring the right teams together around shared problems. Align on priorities and assign next steps until issues are resolved.
Turn help desk metrics into progress, not busywork, with Front
Help desks can automate simple, repetitive queries, allowing teams to spend more time on complex interactions that require human judgment. But once workflows involve multiple teams, high-touch accounts, and long-running threads, help desks quickly hit their limits and the metrics they produce stop reflecting actual work.
Complex B2B environments need Front to keep everyone in sync, especially when help desk metrics stop translating into results.
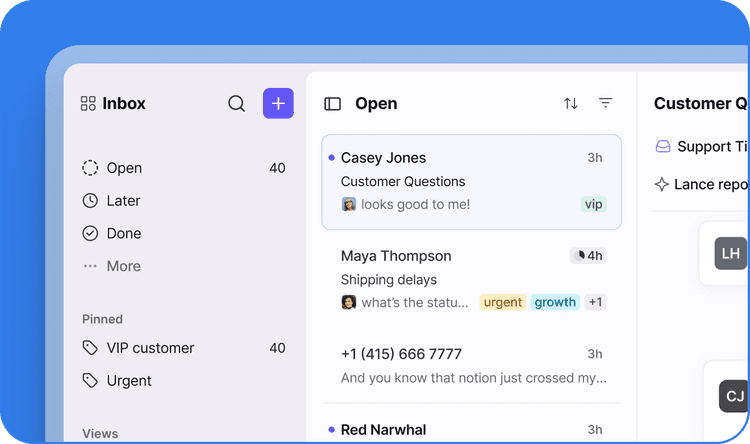
Front helps teams route, escalate, or loop in the right person without losing context. Every conversation lands in one secure inbox, so you can instantly assign owners and track progress, and reports are customized easily to show exactly the data you need.
See how Front maps help desk metrics to complex workflows and drives operational growth. Request a demo today.
FAQ
Which help desk metrics are considered vanity metrics?
Any help desk metric on a dashboard can be a vanity metric if it’s disconnected from the relevant context or goal. Ticket volume, average speed of answer, or cumulative resolved tickets don’t mean much on their own because they only measure how busy your teams are, not how effectively they’re serving customers.
How often should help desk metrics be reviewed?
Review key metrics weekly for emerging issues, with a deeper monthly review to identify trends and guide decisions. The right cadence is a core best practice for help desk metrics, especially as priorities and customer needs change.
What should leaders do when help desk metrics conflict with each other?
Look at the underlying customer and operational context before acting on any single metric. Use help desk KPI examples to compare trade-offs, identify the root cause, and decide which outcomes matter most.