



Not all customer engagement metrics answer the same question. Discover which ones matter, what each reveals, and how to turn them into actionable insights.
Many B2B teams think they’ve got customer engagement figured out. The dashboard shows customer satisfaction (CSAT) improving, churn falling, and daily active users (DAUs) climbing — so things must be working, right?
Marketing celebrates the uptick. Product points to feature adoption. Customer success highlights survey responses. Everyone sees movement in the numbers and assumes it means progress.
But that’s not how customer engagement metrics work. Each metric only tells part of the story — shaped by how it’s measured, when it’s collected, and what it leaves out.
The real question is whether these metrics actually reflect something you can trust — and act on.
In this article, we’ll break down how to read engagement metrics more accurately and turn the numbers into real decisions.
What are customer engagement metrics?
Customer engagement metrics measure how often and how consistently customers interact with your business, across conversations, channels, and every stage of the relationship. They’re different from campaign results or product usage stats. They build over time, revealing whether customers are getting value and whether they’re likely to renew.
Because B2B environments involve multiple stakeholders and longer sales cycles, the stakes are higher: What starts as a missed update or slow response can ripple across teams and put revenue and retention at risk.
7 customer engagement metrics B2B teams should track
Every customer engagement metric example serves a different purpose. Some show the health of the relationship. Some show how operations are performing. Others reveal patterns that only appear over time.
These categories help guide teams in choosing the right metric for what they’re trying to understand.
Metrics that measure relationship health
These metrics reveal whether the customer relationship is growing stronger or starting to deteriorate.
Here’s what each one measures, how to calculate it, and what it tells you.
1. Customer satisfaction score (CSAT)
CSAT surveys ask customers how satisfied they are with your product or service, usually on a 1–5 or 1–10 scale. Some teams use a simpler three-point version: unhappy, neutral, or happy.
Calculate CSAT by dividing positive responses by the total number of responses.
While standard CSAT surveys focus on a customer’s perception of a product or service, many teams also use them to gauge engagement — particularly after key interactions, such as onboarding completion or closing a support ticket.
Take a logistics company that sends a CSAT survey after a delayed shipment. High scores indicate clear, timely updates, while low scores expose gaps in responsiveness or visibility at critical moments.
2. Net Promoter Score
Net Promoter Score (NPS) measures how customers feel about their overall experience. It asks one question: how likely are you to recommend us, on a scale of 0 to 10?
It segments responses into promoters (those who answered 9 or 10), passives (those who answered 7 or 8), and detractors (those who answered 0 to 6). The final score is calculated by subtracting the percentage of detractors from the percentage of promoters.
On its own, NPS shows sentiment, not causes. In B2B, the real value comes from breaking the score down by account. A detractor at a $100K account hits much harder than one at a $5K account, even though they each count as a single response.
3. Churn rate
Churn rate shows the percentage of customers who cancel their subscriptions over a specified time period. It measures engagement by revealing where service falls short of what was promised.
To calculate churn rate, divide the number of customers lost during a given period by the total number of customers at the start of the period.
For B2B service teams, rising churn usually points to coordination problems and patchy communication (not just bad outcomes). It’s a sign that how you deliver matters as much as what you deliver.
Metrics that measure operational performance
These metrics are your first warning signs. They move before CSAT or churn rate do, which makes them early warning signals when something is slipping through the cracks.
4. First response time
First response time is how long it takes a customer rep to reply to a customer inquiry. For teams flooded with calls, emails, and live chat requests, first response time is one of the clearest signs of service quality and accountability.
It’s typically calculated by dividing the total number of response times by the total number of inquiries (email, tickets, etc.).
For a travel-management business, a slow response time on booking issues signal poor responsiveness when urgency is highest. Fast responses, on the other hand, show the team is on it — coordinated and ready to act.
5. First contact resolution rate (FCR)
FCR measures the percentage of customer inquiries resolved during the first interaction, without any follow-ups or escalations.
A higher FCR shows that your customer reps have the context and resources needed to resolve issues correctly the first time. It also builds customer trust, since clients value their time and prefer not to go back and forth to get a satisfactory answer.
To calculate FCR, divide the number of inquiries resolved on the first interaction by the total number of inquiries.
Metrics that reveal engagement patterns over time
These metrics reveal the depth of customer engagement over time, and they’re most useful in a B2B software-as-a-service (SaaS) setting or for customer success teams managing product-led accounts.
6. Feature adoption rate
Feature adoption rate measures the percentage of users who adopt a specific feature within a given time frame.
For B2B and SaaS teams, this number relates to their customer engagement KPIs. It shows whether customers are deriving sustained value from your product or service. Feature adoption isn’t about trying a feature once — it’s about continued use over time.
The more your customers actually use what you built, the more value they find, and the less likely they are to leave.
To calculate feature adoption rate, divide the number of customers who engaged with a specific feature by the total number of users (active or new) during the same period.
7. Customer lifetime value (CLV)
CLV measures the total revenue a customer generates over their entire relationship with your company. It shows how much value steady engagement creates over time, and it helps teams spot which accounts will keep paying off long after a deal closes.
High-CLV accounts usually share one trait: consistent engagement. The customer stays in the loop, the right people get involved at the right time, and the experience feels easy.
To calculate CLV accurately:
Measure average revenue per customer by dividing total revenue by the number of active customers during a given period.
Determine gross margin to assess the true profitability of that revenue: Subtract the cost of goods sold from total revenue, then divide by total revenue.
Calculate CLV using this formula: CLV = (Average revenue per customer × Gross margin) / Churn rate.
How to measure customer engagement for operational signals
Measuring customer engagement isn’t just about tracking numbers. When metrics exist in isolation, they become vanity metrics — numbers with no context that don’t guide decisions.
For example, if CSAT drops but no one can trace it back to a conversation or team member, you know something went wrong. You just don’t know what or where.
But three steps can make these metrics operationally actionable:
Read metrics alongside at least one other relevant metric to uncover patterns.
Connect metrics to the actual interactions that produced them, so you understand the underlying cause.
Review metrics on a cadence that matches their movement, ensuring timely responses.
Following these steps turns a customer engagement metric from a passive report into a signal that drives action and provides true visibility.
Turn customer engagement insights into visibility with Front
When metrics and conversations live in separate places, the gap between numbers and context grows. It gets harder to identify the causes behind a metric, link signals to real customer moments, or connect feedback to actual behavior.
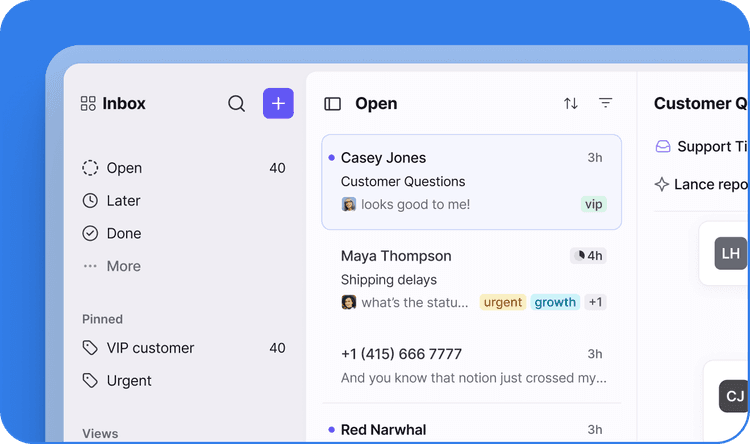
Front Analytics bridges that gap by providing operations and support leaders with real-time visibility into response times, resolution rates, and CSAT trends, without relying on manual reports.
Front AI takes this visibility further with Smart CSAT, which automatically infers satisfaction from every conversation, giving teams a continuous read on how service is actually perceived. Omnichannel support and workflow automation add another layer, keeping every channel in view and helping teams act on metrics once they know they identify friction points.
Ready to see how Front gives your team visibility? Explore the platform today.